— p. 1 — UNCLASSIFIED
UNCLASSIFIED
All-domain Anomaly Resolution Office
U.S. Department of Defense
Case: “Go Fast”
Case Resolution | February 6, 2025
Case Overview
In January 2015, a U.S. Navy F/A-18F pilot
recorded an object using a Forward Looking
Infrared (FLIR) sensor about 13,000 feet
above the Atlantic Ocean off the coast of
Florida.
The video appeared to show the object moving
at high speed. AARO cannot definitively
identify the object, but it displayed no
anomalous performance characteristics.
The Department of Defense officially released
the “Go Fast” video in 2020. It is available
for public viewing at the Navy’s FOIA
Reading Room.
Key Findings
AARO assesses with high confidence that the
object did not move at anomalous speeds.
AARO's analysis showed:
• The object’s altitude was
approximately 13,000 feet.
• The object’s speed ranged from about
32 m/s (72 mph) to 72 m/s (161 mph)
depending on its heading relative to
the wind. Compensating for the
wind’s contribution to the object’s
speed, its approximate speed range is 2
m/s (5 mph) to 41.3 m/s (92 mph).
• The object’s heading deviated as much as 32° from wind direction, though most
simulations conducted during AARO’s analysis showed significantly less difference.
The object did not move against the wind in any simulation.
Case Essentials
Location: Eastern coast of Florida
Date: January 2015
Object Altitude (reported): Near ocean’s
surface
Object Altitude (assessed): 13,000 feet
Object Speed (reported): Appeared to
move at high speeds
Object Speed (assessed): 5 mph - 92 mph
Object Shape (reported): Round
Object Shape (assessed): Spherical or
oblate ellipsoid
Reporter: U.S. Navy
Sensor: Forward Looking Infrared
Reported Behavior: Moved at high speeds
near the ocean’s surface
Assessed Behavior: An object moving
between 5 and 92 mph at approximately
13,000 feet
Summary of Findings: High confidence
the object did not demonstrate anomalous
performance characteristics
— 第 1 页 — 未分类
全域异常解决办公室
美国国防部
案例:“Go Fast”
案例结案 | 2025年2月6日
案例概述
2015年1月,一名美国海军 F/A-18F 飞行员使用前视红外(FLIR)传感器,在佛罗里达州海岸外大西洋上空约13,000英尺处录下了一个物体。
视频看似显示该物体高速移动。AARO 无法明确识别该物体,但它未表现出异常性能特征。
国防部于2020年正式公开了“Go Fast”视频。可在海军 FOIA 阅览室公开观看。
主要发现
AARO 以高置信度评估该物体未以异常速度移动。AARO 的分析显示:
• 该物体的高度约为13,000英尺。
• 该物体的速度介于约32米/秒(72英里/小时)至72米/秒(161英里/小时)之间,取决于其相对于风的航向。在补偿了风对物体速度的贡献后,其大致速度范围为2米/秒(5英里/小时)至41.3米/秒(92英里/小时)。
• 该物体的航向与风向的偏差最大达32°,尽管 AARO 分析期间进行的大多数模拟显示出的差异要小得多。在任何一次模拟中,该物体都未逆风移动。
案例要点
地点:佛罗里达州东海岸
日期:2015年1月
物体高度(报告):接近海面
物体高度(评估):13,000英尺
物体速度(报告):看似高速移动
物体速度(评估):5英里/小时 - 92英里/小时
物体形状(报告):圆形
物体形状(评估):球形或扁椭球形
报告者:美国海军
传感器:前视红外
报告的行为:在海面附近高速移动
评估的行为:一个在约13,000英尺、以5至92英里/小时之间速度移动的物体
发现摘要:高置信度认为该物体未表现出异常性能特征
— p. 2 — UNCLASSIFIED
2
UNCLASSIFIED
Determining the object’s true speed and direction of travel (heading) requires knowing the F/A-
18F’s heading. AARO calculated the object’s speed and heading relative to the aircraft because
the video display does not contain the aircraft’s heading. AARO calculated the object’s position
and direction of travel for the entire range of possible wind directions (0° - 360°) to account for
differences in atmospheric conditions between the F/A-18F’s altitude and object’s altitude. This
comprehensive modeling informed AARO’s assessment of whether the object moved with or
against the wind and whether it behaved anomalously for all possible directions of travel.
AARO factored in historical wind speeds and directions at both the object’s altitude (13,000 feet)
and the aircraft’s altitude (25,000 feet), as measured near the time and location of the event:
• At 13,000 feet, wind speed was 30.9 m/s (69 mph) from the west (265°).
• At 25,000 feet, wind speed was 52 m/s (116 mph) from the west southwest (255°).
Figure 1 shows the object’s range of possible speeds calculated while compensating for wind
speed at 13,000 feet. This is considered the “intrinsic” speed. An intrinsic speed of 0 m/s
indicates that the object is moving with the wind, or about 30.9 m/s.
Figure 1: The y-axis represents the object’s speed with wind effects removed. The x-axis represents the
wind’s heading relative to the F/A-18F’s airframe geometry (0° is a headwind). The curve represents the
object’s range of speeds at each angle. The tailwind, headwind, and crosswind cases are denoted by the
colored lines. The object’s lowest possible speed occurs near a headwind while the highest occurs in a
tailwind.
Figure 2 shows the object’s range of possible headings relative to the wind direction at 13,000
feet. A direction of 0° indicates that the object is moving in the same direction as the wind.
— 第 2 页 — 确定物体的真实速度和行进方向(航向)需要知道 F/A-18F 的航向。由于视频显示不含飞机的航向,AARO 计算了物体相对于飞机的速度和航向。AARO 针对所有可能的风向(0°–360°)计算了物体的位置和行进方向,以考虑 F/A-18F 高度与物体高度之间大气条件的差异。这种全面建模为 AARO 评估物体是顺风还是逆风移动、以及在所有可能行进方向上是否表现异常提供了依据。
AARO 纳入了在事件发生时间和地点附近测得的、物体高度(13,000英尺)与飞机高度(25,000英尺)处的历史风速和风向:
• 在13,000英尺处,风速为30.9米/秒(69英里/小时),来自西方(265°)。
• 在25,000英尺处,风速为52米/秒(116英里/小时),来自西南偏西(255°)。
图1显示了在补偿13,000英尺处风速时计算出的物体可能速度范围。这被视为“固有”速度。固有速度为0米/秒表示物体随风移动,即约30.9米/秒。
图1:y 轴表示去除风影响后的物体速度。x 轴表示风向相对于 F/A-18F 机身几何的航向(0°为顶风)。曲线表示物体在每个角度下的速度范围。顶风、顺风和侧风情形由彩色线标示。物体的最低可能速度出现在接近顶风时,最高出现在顺风时。
图2显示了物体相对于13,000英尺处风向的可能航向范围。0°方向表示物体与风同向移动。
— p. 3 — UNCLASSIFIED
3
UNCLASSIFIED
Figures 1 and 2 can be used to find the object’s speed and heading compared to the wind for any
direction of the F/A-18F’s travel relative to the prevailing wind direction. As examples, the
object’s apparent speed and direction is summarized here for four scenarios: headwind,
crosswind from the left, tailwind, and crosswind from the right.
1. Headwind (aircraft flying into the wind): The object moved 2.0 m/s (5 mph) faster than
the wind, at a heading of ° 5° off-wind.
2. Left Crosswind (wind coming from the left side): The object moved 26.5 m/s (59 mph)
faster than the wind, heading 31.5° off-wind.
3. Tailwind (aircraft flying with the wind): The object moved 41.3 m/s (92 mph) faster
than the wind, heading 12.3° off-wind.
4. Right Crosswind (wind coming from the right side): The object moved 27.7 m/s (62
mph) faster than the wind, heading 9.5° off-wind.
The object’s performance characteristics are consistent with historical wind conditions in each
scenario. AARO assesses the object did not demonstrate anomalous performance characteristics.
The object’s apparent high speed is attributable to motion parallax. Motion parallax is an optical
effect that induces an observer to perceive that a stationary or slow-moving object is moving
much faster than that the subject object’s actual speed when viewed from a moving frame of
Figure 2: The y-axis represents the difference between the object’s heading and the wind direction at 13,000
feet. The x-axis represents the wind’s heading relative to the F/A-18F’s airframe geometry (0° is a headwind).
The curve represents the object’s range of possible directions compared to the wind. The tailwind, headwind,
and crosswinds are denoted by the colored lines. The maximum deviation in the UAP’s direction of travel
from wind direction is 32.1°.
— 第 3 页 — 图1和图2可用于求出 F/A-18F 相对于盛行风向的任意行进方向下,物体相对于风的速度和航向。作为示例,以下针对四种情形总结了物体的表观速度和方向:顶风、来自左侧的侧风、顺风,以及来自右侧的侧风。
1. 顶风(飞机迎风飞行):物体比风快2.0米/秒(5英里/小时),航向偏离风向5°。
2. 左侧风(风来自左侧):物体比风快26.5米/秒(59英里/小时),航向偏离风向31.5°。
3. 顺风(飞机顺风飞行):物体比风快41.3米/秒(92英里/小时),航向偏离风向12.3°。
4. 右侧风(风来自右侧):物体比风快27.7米/秒(62英里/小时),航向偏离风向9.5°。
在每种情形下,物体的性能特征都与历史风况相符。AARO 评估该物体未表现出异常性能特征。物体的表观高速可归因于运动视差。运动视差是一种光学效应,当从一个移动的参考系观察时,会使观察者觉得静止或缓慢移动的物体的移动速度远快于该对象物体的实际速度。
图2:y 轴表示物体航向与13,000英尺处风向之间的差异。x 轴表示风向相对于 F/A-18F 机身几何的航向(0°为顶风)。曲线表示物体相对于风的可能方向范围。顶风、顺风和侧风由彩色线标示。UAP 行进方向偏离风向的最大偏差为32.1°。
— p. 4 — UNCLASSIFIED
4
UNCLASSIFIED
reference. The more quickly an observer moves relative to an observed object, the more
pronounced this effect is.
Data Quality and Methodology
AARO analyzed the publicly available 34-second FLIR video, because the original file and its
accompanying metadata are no longer available. The video display provided sufficient
information to assess the object’s altitude and a range of possible speeds. The display showed:
• The range (distance) from the FLIR sensor to the target.
• The FLIR camera’s azimuth (left-right angle) and elevation (up-down angle).
• The aircraft's altitude, speed, and tilt (bank angle).
The aircraft’s exact location and heading (compass direction) during the recording are unknown.
AARO could not calculate a single speed or heading for the object because the aircraft’s
calculated flight path depends on its exact heading, and the object’s calculated location depends
on the aircraft’s location. Instead, the analysis considered all possible aircraft headings (from 0°
to 360°) to calculate a range of possible speeds and headings for the object. These calculations
include a small margin of error, because the range from the sensor to the object and the sensor
angles are only accurate to a single decimal place.
AARO could not determine the object’s size due to the video’s low resolution and the range from
the sensor to the object. However, pixel analysis (a method of measuring an object’s size based
on pixels relative to an object known dimensions) by AARO’s Intelligence Community partner
suggested the object was one meter or less in size - comparable to a small drone or bird.
For more technical details on assumptions and methodology, see Appendix A: Estimating UAP
Location, Speed, and Heading from “Go Fast” FLIR Video Data.
— 第 4 页 — 参考系。观察者相对于被观察物体移动得越快,这种效应越明显。
数据质量与方法
AARO 分析了公开可得的34秒 FLIR 视频,因为原始文件及其随附的元数据已不再可得。视频显示提供了足以评估物体高度和可能速度范围的信息。该显示显示了:
• 从 FLIR 传感器到目标的距离(range)。
• FLIR 相机的方位(左右角)和俯仰(上下角)。
• 飞机的高度、速度和倾斜(横滚角)。
录制期间飞机的确切位置和航向(罗盘方向)未知。AARO 无法计算物体的单一速度或航向,因为飞机计算出的飞行路径取决于其确切航向,而物体计算出的位置取决于飞机的位置。因此,分析考虑了所有可能的飞机航向(从0°到360°),以计算物体可能速度和航向的范围。这些计算包含一个小的误差余量,因为从传感器到物体的距离以及传感器角度仅精确到小数点后一位。
由于视频分辨率低以及传感器到物体的距离,AARO 无法确定物体的尺寸。然而,AARO 情报界合作伙伴进行的像素分析(一种基于像素相对于已知尺寸物体来测量物体大小的方法)表明该物体的尺寸为一米或更小——与一架小型无人机或一只鸟相当。
有关假设和方法的更多技术细节,见附录A:根据“Go Fast”FLIR 视频数据估算 UAP 的位置、速度和航向。
— p. 5 — UNCLASSIFIED
5
UNCLASSIFIED
Appendix A: Estimating UAP Location, Speed, and Heading from
“Go Fast” FLIR Video Data
February 2025
Introduction
In 2024, the All-domain Anomaly Resolution Office (AARO) estimated possible altitude, speed,
and heading solutions for an unidentified anomalous phenomenon (UAP), commonly known as
“Go Fast.” The executive summary, general overview, and conclusions are provided in the
AARO “Go Fast” Case resolution [ref 1]. This paper presents a more in-depth data analysis for
those interested in the mathematics and calculations applied to the forward-looking infrared
(FLIR) video footage captured by an AN/ASQ sensor pod onboard the F/A-18 Super Hornet
observing the event in January 2015. AARO manually extracted data from a publicly available
video of the “Go Fast” event as the source material to conduct its analysis.
Video footage collected via military sensors, like the AN/ASQ, are not required to collect Full-
Motion Video (FMV) or other Intelligence Surveillance and Reconnaissance (ISR) products.
Therefore, it is not intended to support intelligence or other rigorous analysis. Thus, video
footage from these platforms often contains compression artifacts or lacks the necessary
metadata to conduct an exhaustive analysis.
For proper FMV products, standard analysis is done using software packages such as SOCET
GXP [ref 2]. SOCET GXP is a suite of geospatial analytic software tools that utilize satellite and
airborne imagery to measure and detect objects and phenomena. Generally, FMV is used to
track objects on the surface of the earth such as road vehicles, ships, and tanks. In these cases,
an object’s location can be determined since an FMV sensor knows where it is and where it is
pointed and can then calculate the distance to the ground point. In the case of the “Go-Fast”
video, the object is not on the ground and the sensor/aircraft location is not provided in the
metadata.
Despite these limitations, the basic techniques used in FMV analysis can be applied with some
alteration for analyzing UAP cases. AARO reconstructed the F/A-18’s flight path and position
and assessed possible trajectories of the “Go Fast” UAP using the mathematics, standard
methods, and conventions defined in the National Geospatial-Intelligence Agency’s (NGA)
Motion Imagery Standards Board’s UAS Datalink Local Set Standards (MISB ST 0601.19 dated
March 02, 2023) [ref 3]. Step-by-step calculations are provided in this paper to estimate the
motion characteristics of the UAP in the “Go Fast” event from the same video accessible by the
public.
— 第 5 页 — 附录A:根据“Go Fast”FLIR 视频数据估算 UAP 的位置、速度和航向
2025年2月
引言
2024年,全域异常解决办公室(AARO)为一个俗称“Go Fast”的不明异常现象(UAP)估算了可能的高度、速度和航向解。执行摘要、总体概述与结论见 AARO“Go Fast”案例结案[ref 1]。本文为有兴趣了解应用于前视红外(FLIR)视频画面之数学与计算的读者,呈现更深入的数据分析;该视频由 F/A-18 超级大黄蜂上的一个 AN/ASQ 传感器吊舱在2015年1月观察该事件时拍摄。AARO 从公开可得的“Go Fast”事件视频中手动提取数据作为其分析的源材料。
通过军用传感器(如 AN/ASQ)采集的视频画面,并不被要求采集全动态视频(FMV)或其他情报监视侦察(ISR)产品。因此,它并非旨在支持情报或其他严格的分析。因而,来自这些平台的视频画面往往含有压缩伪影,或缺乏进行详尽分析所需的元数据。
对于正规的 FMV 产品,标准分析使用诸如 SOCET GXP[ref 2]之类的软件包进行。SOCET GXP 是一套地理空间分析软件工具,利用卫星和机载影像来测量和探测物体与现象。一般而言,FMV 用于跟踪地球表面的物体,如道路车辆、船只和坦克。在这些情况下,由于 FMV 传感器知道自身位置和指向,从而能够计算到地面点的距离,物体的位置便可确定。在“Go Fast”视频的情况下,物体不在地面上,且元数据中未提供传感器/飞机的位置。
尽管存在这些局限,FMV 分析所用的基本技术经过一些改动后仍可应用于分析 UAP 案例。AARO 使用国家地理空间情报局(NGA)运动影像标准委员会的《无人机系统数据链本地集标准》(MISB ST 0601.19,2023年3月2日发布)[ref 3]中定义的数学、标准方法和约定,重建了 F/A-18 的飞行路径和位置,并评估了“Go Fast”UAP 的可能轨迹。本文提供逐步计算,以从公众可访问的同一视频估算“Go Fast”事件中 UAP 的运动特征。
— p. 6 — UNCLASSIFIED
6
UNCLASSIFIED
Data
The only data available to AARO from the “Go Fast” event were from a compressed Windows
Media File (.wmv) [ref 4]. The recording’s metadata does not contain the F/A-18’s
georeferenced position and heading, which are necessary to determine the UAP’s absolute
position and flight characteristics. The sensor display does contain enough information to find a
speed, relative heading, and altitude of the UAP. These necessary pieces of information are the
elevation angle of the sensor, the azimuth angle of the sensor, the range from the F/A-18 to the
target, the F/A-18 altitude, the F/A-18 speed, and relative frame times. The sensor pod display
shows most of these values as integers, limiting the fidelity of the initial calculations.1 The
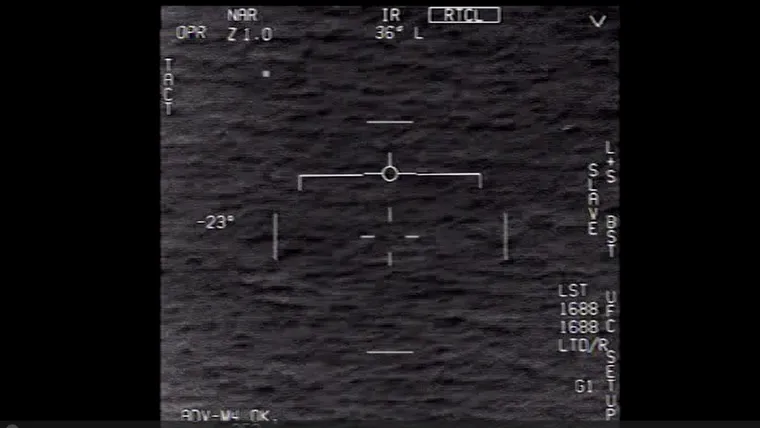
display is shown in Figure 1 with these fields labeled.
Figure 3: One of the two frames used in the analysis with annotated fields indicate the data extracted from the
video and used in calculations.
To estimate the UAP speed, the first step was to determine its location at two positions separated
by a known time period. For this, the range to the target must be known. From 4232 seconds
until the end of the video, the tracker acquired a target track on the UAP, enabling the range to
be reported. Within this portion AARO focused its analysis on a 13-second excerpt from the
footage between 4239 seconds (“t1”) and 4252 seconds (“t2”). AARO selected this segment
because, between t1 and t2, the aircraft’s bank angle, altitude, and airspeed remained nearly
constant. This simplified the estimation of the F/A-18 flight characteristics due to the reduced
number of variables. At t1, the F/A-18’s range to the UAP was 4.0 NM and closed in range to
3.4 NM at t2.
1 Following sections will outline a methodology to estimate values with more precision.
— 第 6 页 — 数据
AARO 从“Go Fast”事件获得的唯一数据来自一个压缩的 Windows Media 文件(.wmv)[ref 4]。该录制的元数据不包含 F/A-18 的地理参考位置和航向,而这些是确定 UAP 绝对位置和飞行特征所必需的。传感器显示确实含有足以求出 UAP 速度、相对航向和高度的信息。这些必要的信息是:传感器的俯仰角、传感器的方位角、F/A-18 到目标的距离、F/A-18 的高度、F/A-18 的速度,以及相对帧时间。传感器吊舱显示将这些数值中的大多数显示为整数,限制了初始计算的保真度。¹ 该显示如图1所示,并标注了这些字段。
图3:用于分析的两帧之一,标注的字段表示从视频中提取并用于计算的数据。
为估算 UAP 速度,第一步是确定其在相隔一个已知时间段的两个位置上的位置。为此,必须知道到目标的距离。从4232秒直到视频结束,跟踪器获取了对 UAP 的目标航迹,使距离得以被报告。在这一部分内,AARO 将其分析集中于画面中4239秒(“t1”)至4252秒(“t2”)之间的13秒片段。AARO 选择此片段是因为在 t1 与 t2 之间,飞机的横滚角、高度和空速近乎恒定。由于变量数量减少,这简化了对 F/A-18 飞行特征的估算。在 t1,F/A-18 到 UAP 的距离为4.0海里,到 t2 缩短至3.4海里。
¹ 后续章节将概述一种更精确地估算数值的方法。
— p. 7 — UNCLASSIFIED
7
UNCLASSIFIED
Table I contains the data extracted from the video footage at t1 and t2. Range and altitude were
converted to metric units to maintain consistency in calculations. The F/A-18 bank angle was
measured using the yellow lines drawn over the level flight and roll indicator lines in the display
as depicted in Figure 1. This angle, denoted by θB, was approximately 14° from t1 to t2. An
average aircraft altitude of 7,621 m was assumed over this time frame. The speed in Mach
number was converted to m/s [ref 5] at the altitude of the F/A-18, resulting in an average speed
of about 190 m/s over the time frame.
Table I: Data extracted from frames at 4239 seconds and 4252 seconds in the “Go Fast” video.
UAP Location Calculation Methodology
This section contains step-by-step calculations for finding the UAP locations relative to the F/A-
18 at two points in the “Go Fast” UAP event. This provides the reader with a foundational
understanding of the methodology and rough estimate of the speed and heading of the UAP. The
methodology will then be applied to all frames in the t1 to t2 interval in a later section.
Since the data do not provide an absolute location for the F/A-18 at t1, the aircraft was arbitrarily
placed at a reference point that simplified the problem: the origin of an x-y-z cartesian
coordinate system. The axes of this system were defined in a manner consistent with the MISB
ST 0601.19 [ref 3, p. 12] and provided here in Figure 2. The aircraft longitudinal axis is the +x-
axis, the transverse axis the +y-axis, and the vertical axis the +z-axis.Parameter Frame 1 Sensor
Display Value
Frame 1
Converted
Frame 2 Sensor
Display Value
Frame 2
Converted
Time 4239 sec 0 sec 4252 sec 13 sec
Sensor Azimuth 49° 49° 57° 57°
Sensor Elevation -29° -29° -35° -35°
Range to Target 4.0 NM 7408 m 3.4 NM 6297 m
Aircraft Altitude 25,000 ft 7620 m 25,010 ft 7623 m
Aircraft Velocity 0.61 M 188 m/s* 0.62 M 191 m/s*
*-assumes speed of sound (M=1) at 25,000 ft is 601 knots [ref 5]
— 第 7 页 — 表I 包含从视频画面中在 t1 和 t2 提取的数据。距离和高度被转换为公制单位以保持计算的一致性。F/A-18 的横滚角使用如图1所示、绘制在显示器上平飞与横滚指示线之上的黄线测量。该角度记为 θB,从 t1 至 t2 约为14°。在此时间段内假定飞机平均高度为7,621米。以马赫数表示的速度在 F/A-18 高度处被转换为米/秒[ref 5],得出该时间段内约190米/秒的平均速度。
表I:从“Go Fast”视频中4239秒和4252秒的帧提取的数据。
| 参数 | 帧1传感器显示值 | 帧1换算 | 帧2传感器显示值 | 帧2换算 |
|---|---|---|---|---|
| 时间 | 4239秒 | 0秒 | 4252秒 | 13秒 |
| 传感器方位 | 49° | 49° | 57° | 57° |
| 传感器俯仰 | -29° | -29° | -35° | -35° |
| 到目标距离 | 4.0海里 | 7408米 | 3.4海里 | 6297米 |
| 飞机高度 | 25,000英尺 | 7620米 | 25,010英尺 | 7623米 |
| 飞机速度 | 0.61马赫 | 188米/秒* | 0.62马赫 | 191米/秒* |
\*—假定25,000英尺处音速(M=1)为601节[ref 5]
UAP 位置计算方法
本节包含用于求出“Go Fast”UAP 事件中两个时间点上 UAP 相对于 F/A-18 位置的逐步计算。这为读者提供了对该方法的基础理解,以及对 UAP 速度和航向的粗略估计。该方法随后将在后续章节中应用于 t1 至 t2 区间内的所有帧。
由于数据未提供 F/A-18 在 t1 的绝对位置,飞机被任意置于一个能简化问题的参考点:x-y-z 笛卡尔坐标系的原点。该坐标系的轴按照与 MISB ST 0601.19[ref 3,第12页]一致的方式定义,并在此处图2中给出。飞机纵轴为 +x 轴,横轴为 +y 轴,垂直轴为 +z 轴。
— p. 8 — UNCLASSIFIED
8
UNCLASSIFIED
Figure 4: The three axes defined relative to an air platform in FMV analysis. Longitudinal is the
+x, Transverse is the +y, and Vertical is the +z (pointing down).
This coordinate system was applied to the F/A-18 as depicted in Figure 3. Because the aircraft
altitude was constant over the duration of flight, its path is level and confined to the x-y plane (z
= 0).
Figure 5: The top-down view coordinate system defined with the position of the F/A-18 at the origin with
coordinates [0,0,0]. The aircraft is moving in the +x direction.
With the position of the F/A-18 defined at t1, the location of the UAP relative to this position was
calculated. This calculation was done by defining a line-of-sight (LOS) or “pointing” vector and
then rotating this vector around the axes by the sensor azimuth and elevation angles given in
Table I in order to point to the location of the UAP.
The angle of rotation about the x-axis is the aircraft roll and is denoted by α; the angle of rotation
about the y-axis is the “up and down” motion due to the aircraft pitch or sensor pointing
— 第 8 页 — 图4:FMV 分析中相对于空中平台定义的三个轴。纵向为 +x,横向为 +y,垂直为 +z(指向下方)。
如图3所示,此坐标系被应用于 F/A-18。由于飞机在飞行期间高度恒定,其路径是平的,且限于 x-y 平面(z = 0)。
图5:以 F/A-18 处于原点、坐标为[0,0,0]定义的俯视坐标系。飞机沿 +x 方向移动。
在 t1 处定义了 F/A-18 的位置后,计算了 UAP 相对于此位置的位置。该计算通过定义一条视线(LOS)或“指向”向量,然后将此向量按表I 给出的传感器方位角和俯仰角绕各轴旋转,以指向 UAP 的位置来完成。
绕 x 轴的旋转角是飞机横滚,记为 α;绕 y 轴的旋转角是由于飞机俯仰或传感器指向
— p. 9 — UNCLASSIFIED
9
UNCLASSIFIED
elevation and denoted by β; the angle of rotation about the z-axis is the “left and right” motion
due to aircraft yaw or sensor pointing azimuth and denoted by γ. For this FLIR sensor, the bank
(or roll) angle of the aircraft is included in the elevation and angles of the sensor and not treated
separately. The reader is encouraged to consult [ref 3] for additional explanation of these angles.
These rotations were carried out by applying 2-D rotation matrices derived from the underlying
trigonometry [ref 6]. Equations (1), (2), and (3) provide these 3x3 rotation matrices about the x-,
y-, and z-axes by the defined angles α, β, and γ respectively.
𝑅𝑥(𝛼) = [
1 0 0
0 cos(𝛼) − sin(𝛼)
0 sin(𝛼) cos(𝛼)
] (1)
𝑅𝑦(𝛽) = [
cos (𝛽) 0 sin (𝛽)
0 1 0
− sin(𝛽) 0 cos(𝛽)
] (2)
𝑅𝑧(𝛾) = [
cos (𝛾) −sin (𝛾) 0
sin (𝛾) cos(𝛾) 0
0 0 1
] (3)
These rotations are relative to the aircraft attitude. Therefore, the initial LOS was defined as a
unit vector pointing straight ahead from the F/A-18 along the +x-axis. This vector is represented
in cartesian (x, y, z) vector notation as v = <1,0,0>. The vector’s magnitude is defined by the
range to the UAP. Properly rotating, or pointing, this vector by the given sensor angles yields
the UAP’s relative position to the aircraft.
Position of UAP at t1
The length, or magnitude, of the LOS vector at t1 was defined by multiplying the unit vector v by
the range to the target. At t1 the range was 7,408 m, thus the initial LOS vector was v1 = <7,408,
0, 0> m.
The next step was to point this vector at the UAP. First, it was rotated by the sensor elevation
(pitch) angle β around the y-axis:
𝑅𝑦(𝛽) ∙ 𝒗𝟏 = [
cos (𝛽) 0 sin (𝛽)
0 1 0
− sin(𝛽) 0 cos(𝛽)
] [
7408
0
0
] (4𝑎)
= [
cos (−29°) 0 sin (−29°)
0 1 0
− sin(−29°) 0 cos(−29°)
] [
7408
0
0
] (4𝑏)
— 第 9 页 — 俯仰而产生的“上下”运动,记为 β;绕 z 轴的旋转角是由于飞机偏航或传感器指向方位而产生的“左右”运动,记为 γ。对于此 FLIR 传感器,飞机的横滚(或滚转)角已包含在传感器的俯仰和角度中,不单独处理。鼓励读者参阅[ref 3]以获得对这些角度的更多解释。
这些旋转通过应用从基础三角学[ref 6]导出的二维旋转矩阵来执行。方程(1)、(2)和(3)给出了绕 x、y、z 轴分别按所定义角度 α、β、γ 旋转的这些3×3旋转矩阵。
𝑅𝑥(𝛼) = [ 1 0 0 ]
[ 0 cos(𝛼) −sin(𝛼) ] (1)
[ 0 sin(𝛼) cos(𝛼) ]
𝑅𝑦(𝛽) = [ cos(𝛽) 0 sin(𝛽) ]
[ 0 1 0 ] (2)
[ −sin(𝛽) 0 cos(𝛽) ]
𝑅𝑧(𝛾) = [ cos(𝛾) −sin(𝛾) 0 ]
[ sin(𝛾) cos(𝛾) 0 ] (3)
[ 0 0 1 ]
这些旋转是相对于飞机姿态的。因此,初始 LOS 被定义为从 F/A-18 沿 +x 轴笔直向前指向的单位向量。该向量以笛卡尔(x, y, z)向量记法表示为 v = <1,0,0>。该向量的大小由到 UAP 的距离定义。将该向量按给定的传感器角度正确旋转(或指向),即得出 UAP 相对于飞机的位置。
t1 处 UAP 的位置
LOS 向量在 t1 的长度(或大小)通过将单位向量 v 乘以到目标的距离来定义。在 t1,距离为7,408米,因此初始 LOS 向量为 v1 = <7,408, 0, 0> 米。
下一步是将此向量指向 UAP。首先,将其绕 y 轴按传感器俯仰(pitch)角 β 旋转:
𝑅𝑦(𝛽) ∙ 𝒗𝟏 = [ cos(−29°) 0 sin(−29°) ] [ 7408 ] (4a–4b)
[ 0 1 0 ] [ 0 ]
[ −sin(−29°) 0 cos(−29°) ] [ 0 ]
— p. 10 — UNCLASSIFIED
10
UNCLASSIFIED
= [
7408 ∙ cos(−29°) + 0 ∙ 0 + 0 ∙ sin (−29°)
7408 ∙ 0 + 0 ∙ 1 + 0 ∙ 0
7408 ∙ −sin(−29°) + 0 ∙ 0 + 0 ∙ cos (−29°)
] (4𝑐)
= [
6479
0
3591
] (4𝑑)
Next, the vector result from (4d) was rotated about the z-axis by the sensor azimuth, γ. Note that
the sensor is pointing 49° to the left (designated by the “L”), which is a negative angle in the
defined coordinate system. These calculations are provided in (5a-d):
𝑅𝑧(𝛾) ∙ 𝑣𝐿𝑂𝑆 = [
cos (𝛾) −sin (𝛾) 0
sin (𝛾) cos(𝛾) 0
0 0 1
] [
6479
0
3591
] (5𝑎)
= [
cos (−49°) −sin (−49°) 0
sin (−49°) cos(−49°) 0
0 0 1
] [
6479
0
3591
] (5𝑏)
= [
6479 ∙ cos(−49°) + 0 ∙ − sin(−49°) + 3591 ∙ 0
6479 ∙ sin(−49°) + 0 ∙ cos (−49°) + 3591 ∙ 0
6479 ∙ 0 + 0 ∙ 0 + 3591 ∙ 1
] (5𝑐)
= [
4251
−4890
3591
] (5𝑑)
The resulting vector <4,251, -4,890, 3,591> m means that the UAP was located 4,251 m ahead,
4,890 m to the left (the y-coordinate is negative), and 3,591 m below (the +z-axis is pointing
down) the F/A-18. At 3,591 m below the F/A-18 the UAP was at an altitude of 4,029 m (13,219
ft).
Location of UAP at t2
To find the UAP location at t2, the F/A-18 location had to be estimated based upon the known
flight dynamics. Because the aircraft was banking at 14° between t1 and t2, it was turning in a
curved path while moving at an average speed of 190 m/s. As it turned it also changed heading
away from the +x-axis. This rotation away from the axis can be represented as a yaw angle of φ
relative to its orientation at t1, as depicted in Figure 4.
The curved path of the F/A-18 is essentially part of a circle. The radius of that circle, or radius
of curvature, was found from (6).
𝑅𝑐 = 𝑣𝐹𝐴182
𝑔 ∙ tan(𝜃𝐵) (6)
— 第 10 页 — = [ 7408·cos(−29°) + 0·0 + 0·sin(−29°) ]
[ 7408·0 + 0·1 + 0·0 ] (4c)
[ 7408·−sin(−29°) + 0·0 + 0·cos(−29°) ]
= [ 6479 ]
[ 0 ] (4d)
[ 3591 ]
接下来,将(4d)的向量结果绕 z 轴按传感器方位角 γ 旋转。注意传感器指向左侧49°(以“L”标示),在所定义的坐标系中为负角。这些计算在(5a–d)中给出:
𝑅𝑧(𝛾) ∙ 𝑣𝐿𝑂𝑆 = [ cos(−49°) −sin(−49°) 0 ] [ 6479 ] (5a–5b)
[ sin(−49°) cos(−49°) 0 ] [ 0 ]
[ 0 0 1 ] [ 3591 ]
= [ 6479·cos(−49°) + 0·−sin(−49°) + 3591·0 ]
[ 6479·sin(−49°) + 0·cos(−49°) + 3591·0 ] (5c)
[ 6479·0 + 0·0 + 3591·1 ]
= [ 4251 ]
[ −4890 ] (5d)
[ 3591 ]
所得向量 <4,251, -4,890, 3,591> 米意味着 UAP 位于 F/A-18 前方4,251米、左侧4,890米(y 坐标为负)、下方3,591米(+z 轴指向下方)处。在 F/A-18 下方3,591米处,UAP 处于4,029米(13,219英尺)的高度。
t2 处 UAP 的位置
为求出 t2 处的 UAP 位置,必须基于已知的飞行动力学估算 F/A-18 的位置。由于飞机在 t1 与 t2 之间以14°横滚,它在以190米/秒的平均速度移动时沿弯曲路径转弯。在转弯时它也改变了偏离 +x 轴的航向。这种偏离轴的旋转可表示为相对于其在 t1 朝向的偏航角 φ,如图4所示。
F/A-18 的弯曲路径本质上是一个圆的一部分。该圆的半径,即曲率半径,由(6)求出。
𝑅𝑐 = 𝑣𝐹𝐴18² / ( 𝑔 ∙ tan(𝜃𝐵) ) (6)
— p. 11 — UNCLASSIFIED
11
UNCLASSIFIED
Inserting vFA18 = 190 m/s, the acceleration of gravity g = 9.81 m/s2, and θB = 14° into (6), the
radius of curvature Rc was found to be 14,759 m. These values are shown in Figure 4 with the
radius of curvature and position of the F/A-18 at t2.
Figure 6: The F/A-18 traveled in a curved path from its position at t1 to reach its position at t2.
To find yaw the angle φ at t2, note that the two φ’s in Figure 4 are equal. The total distance
traveled in the partial circle by the F/A-18 moving at 190 m/s over 13 seconds is 2,470 m. Had
the aircraft kept flying to complete a circle, it would have traveled 2·π·Rc or 92,736 m.
Therefore, only 2.66% of a 360° circle was completed thus φ = 9.6°. Since the yaw is
counterclockwise, away from the positive y-axis, it is a negative value, or φ = -9.6°.
To find the F/A-18’s position at t2, the Δx and Δy change in position from the location at t1 must
be found. Equations (7) and (8) use a cylindrical coordinate transformation [ref 8] to do this.
∆𝑦 = 𝑅𝑐 − 𝑅𝑐 ∙ cos(𝜑) = 14,759 ∙ (1 − cos(9.6°)) = 207 𝑚 (7)
∆𝑥 = 𝑟 ∙ sin(𝜑) = 14,759 ∙ sin(9.6°) = 2461 𝑚 (8)
Thus, at t2, the aircraft’s displacement was [2,461, -207, 0] m, or 2,461 meters ahead and 207
meters left2 of its t1 position. This will be used momentarily to find the UAP’s location at t2.
At t2 the UAP was at a range of 6,279 m from the F/A-18 such that the pointing vector, v2, is
given by <6,279, 0 ,0> m. As with t1, the LOS vector was defined as pointed in the direction of
+x-axis, not the heading of the aircraft.3 At t2 the sensor elevation and azimuth angles were β = -
35° and γ = -57°, respectively. The additional yaw of the F/A-18 of -9.6° required one additional
rotation.4 The rotation by -35° about the y-axis to the sensor elevation is given in (7a-7b).5
2 The negative is applied here to conform with our coordinate system.
3 This is not the direction the F/A-18 was pointed, otherwise there would be a y-component of the vector. The additional yaw
angle will be handled in the rotation matrices.
4 The sensor azimuth and F/A-18 yaw could be added and performed in a single rotation. In general, the aircraft would have roll
and pitch and adding the platform angle to the sensor angle may give an incorrect result.
5 The written-out step depicting the multiplication of the matrices is skipped here.
— 第 11 页 — 将 vFA18 = 190米/秒、重力加速度 g = 9.81米/秒²、θB = 14° 代入(6),求得曲率半径 Rc 为14,759米。这些数值连同 t2 处 F/A-18 的曲率半径和位置一并显示在图4中。
图6:F/A-18 沿弯曲路径从 t1 的位置行进到 t2 的位置。
为求出 t2 处的偏航角 φ,注意图4中的两个 φ 相等。F/A-18 以190米/秒在13秒内沿部分圆弧行进的总距离为2,470米。若飞机继续飞行以完成一个完整圆,它将行进 2·π·Rc 即92,736米。因此,仅完成了360°圆的2.66%,故 φ = 9.6°。由于偏航是逆时针、偏离正 y 轴方向,它是一个负值,即 φ = -9.6°。
为求出 F/A-18 在 t2 的位置,必须求出相对于 t1 位置的 Δx 和 Δy 位置变化。方程(7)和(8)使用柱坐标变换[ref 8]来完成此计算。
∆𝑦 = 𝑅𝑐 − 𝑅𝑐 ∙ cos(𝜑) = 14,759 ∙ (1 − cos(9.6°)) = 207 米 (7)
∆𝑥 = 𝑟 ∙ sin(𝜑) = 14,759 ∙ sin(9.6°) = 2461 米 (8)
因此,在 t2,飞机的位移为[2,461, -207, 0]米,即在其 t1 位置前方2,461米、左侧207米²处。这将稍后用于求出 UAP 在 t2 的位置。
在 t2,UAP 距 F/A-18 的距离为6,279米,使得指向向量 v2 为 <6,279, 0, 0> 米。与 t1 一样,LOS 向量被定义为指向 +x 轴方向,而非飞机的航向。³ 在 t2,传感器俯仰角和方位角分别为 β = -35° 和 γ = -57°。F/A-18 额外的 -9.6° 偏航需要一次额外的旋转。⁴ 绕 y 轴按 -35° 旋转到传感器俯仰在(7a–7b)中给出。⁵
² 此处加负号以符合我们的坐标系。
³ 这不是 F/A-18 所指向的方向,否则该向量将有 y 分量。额外的偏航角将在旋转矩阵中处理。
⁴ 传感器方位角和 F/A-18 偏航可以相加并在单次旋转中执行。一般而言,飞机会有横滚和俯仰,将平台角度加到传感器角度上可能给出错误结果。
⁵ 此处略去描绘矩阵相乘的逐步书写。
— p. 12 — UNCLASSIFIED
12
UNCLASSIFIED
𝑅(𝛽)𝑦 ∙ 𝐿𝑂𝑆 = [
cos (−35°) 0 sin (−35°)
0 1 0
− sin(−35°) 0 cos(−35°)
] · [
6297
0
0
] (9𝑎)
= [
5158
0
3612
] (9𝑏)
The rotation about the z-axis by -57° to account for the sensor azimuth is given (8a-8b).
𝑅𝑧(𝛾) ∙ 𝐿𝑂𝑆 = [
cos (−57°) −sin (−57°) 0
sin (−57°) cos(−57°) 0
0 0 1
] ∙ [
5158
0
3612
] (10𝑎)
= [
2809
−4326
3612
] (10𝑏)
And finally, (9a-9b) show the rotation about the z-axis -9.6° for the aircraft yaw relative to
position 1.
𝑅𝑧(𝛾) ∙ 𝐿𝑂𝑆 = [
cos (−9.6°) −sin (−9.6°) 0
sin (−9.6°) cos(−9.6°) 0
0 0 1
] · [
2809
−4326
3612
] (11𝑎)
= [
2049
−4734
3612
] (11𝑏)
This means the UAP was 2,049 m ahead of, 4,734 m to the left of, and 3,612 m below the F/A-
18’s position at t2. We can now apply the coordinates for the F/A-18 from (7) and (8) to find the
UAP location at t2. Adding the UAP’s relative coordinates from (9b) to the aircraft’s Δx and Δy
displacement from t1 to t2 gives the UAP position.
[2,049, −4,734, 3,612] + [2,461, −207, 0] = [4,510, −4,941, 3,612] (12)
The UAP was 3,612 m below the F/A-18, or at an altitude of 4,008 m (13,150 ft), very close to
the altitude at t1 indicating the UAP moved in a mostly level path.
Results
With the location of the UAP known at t1 and t2, the distance between the locations was
calculated using the cartesian coordinate distance formula as shown in (13a-13c).
𝑑 = √(𝑥2 − 𝑥1)2 + (𝑦2 − 𝑦1)2 + (𝑧2 − 𝑧1)2 (13𝑎)
— 第 12 页 — 𝑅(𝛽)𝑦 ∙ 𝐿𝑂𝑆 = [ cos(−35°) 0 sin(−35°) ] · [ 6297 ] = [ 5158 ] (9a–9b)
[ 0 1 0 ] [ 0 ] [ 0 ]
[ −sin(−35°)0 cos(−35°) ] [ 0 ] [ 3612 ]
绕 z 轴按 -57° 旋转以计入传感器方位在(8a–8b)中给出。
𝑅𝑧(𝛾) ∙ 𝐿𝑂𝑆 = [ cos(−57°) −sin(−57°) 0 ] ∙ [ 5158 ] = [ 2809 ] (10a–10b)
[ sin(−57°) cos(−57°) 0 ] [ 0 ] [ −4326 ]
[ 0 0 1 ] [ 3612 ] [ 3612 ]
最后,(9a–9b)显示绕 z 轴按 -9.6° 旋转以计入飞机相对于位置1的偏航。
𝑅𝑧(𝛾) ∙ 𝐿𝑂𝑆 = [ cos(−9.6°) −sin(−9.6°) 0 ] · [ 2809 ] = [ 2049 ] (11a–11b)
[ sin(−9.6°) cos(−9.6°) 0 ] [ −4326 ] [ −4734 ]
[ 0 0 1 ] [ 3612 ] [ 3612 ]
这意味着在 F/A-18 的 t2 位置,UAP 位于其前方2,049米、左侧4,734米、下方3,612米处。我们现在可以应用(7)和(8)中 F/A-18 的坐标来求出 t2 处的 UAP 位置。将(9b)中 UAP 的相对坐标加上飞机从 t1 到 t2 的 Δx 和 Δy 位移,即得 UAP 位置。
[2,049, −4,734, 3,612] + [2,461, −207, 0] = [4,510, −4,941, 3,612] (12)
UAP 位于 F/A-18 下方3,612米处,即处于4,008米(13,150英尺)的高度,与 t1 的高度非常接近,表明 UAP 沿大致水平的路径移动。
结果
在 t1 和 t2 处的 UAP 位置已知后,使用笛卡尔坐标距离公式计算两个位置之间的距离,如(13a–13c)所示。
𝑑 = √( (𝑥2−𝑥1)² + (𝑦2−𝑦1)² + (𝑧2−𝑧1)² ) (13a)
— p. 13 — UNCLASSIFIED
13
UNCLASSIFIED
= √(4,510 − 4,251)2 + (−4,941 − (−4,890))2 + (3,612 − 3,591)2 (13𝑏)
= √67,081 + 2,601 + 441 = 265 𝑚 (13𝑐)
Dividing this distance by the 13 seconds elapsed between t1 and t2 gave an estimated speed of
about 20 m/s or 45 mph. The heading of the UAP, φUAP, was also calculated from the Δx and Δy
components of the locations.
𝜑𝑈𝐴𝑃 = tan−1 (Δ𝑦
Δ𝑥) = tan−1 ((−4,890 − (−4,941))
(4,251 − 4,510) ) = −11.14° (14)
The UAP heading is forward along the +x-axis and slightly in the negative y direction, moving in
the same general direction as the F/A-18 (-9.6°) but about 9 times slower. As a reminder, all
depicted locations and directions are relative to the defined coordinate system. Referencing
directions such as North, South, East, and West cannot be done without knowledge of the
location or heading of the F/A-18.
Estimating the UAP Path of Travel
The previous sections explained the methodology used to calculate the positions of the UAP at
the two endpoints of the time interval, t1 and t2. The resulting speed and relative heading
assumed the UAP traveled in a mostly straight, direct path between these two points. The same
mathematical approach was then applied to every frame of the thirteen-second video to estimate
the continuous path of the UAP from the first to last points. This calculation required an
estimate of the time, sensor azimuth and elevation, range to target, and the F/A-18 location for
all frames in the period. The metadata did provide relative frame times, with 0.033 seconds
elapsing between frames in the 30 Hz video.
Path of the F/A-18
The F/A-18’s altitude, bank angle, and airspeed remained constant between t1 and t2. Therefore,
the radius of the curvature of its flight path remained constant from (6). The distance traveled at
each point in time was the elapsed frame time multiplied by the speed. Location and yaw were
then calculated using the previously describe methods.
Path of the UAP
The sensor azimuth, sensor elevation, and range to the object were changing during the video.
The sensor’s display indicated these changes in integers so that many frames would pass before a
value was incremented or decremented. More accurate estimates were made by noting the
frames and times when a quantity incremented or decremented. For example, in the frame that a
— 第 13 页 — = √( (4,510−4,251)² + (−4,941−(−4,890))² + (3,612−3,591)² ) (13b)
= √( 67,081 + 2,601 + 441 ) = 265 米 (13c)
将此距离除以 t1 与 t2 之间经过的13秒,得出约20米/秒或45英里/小时的估计速度。UAP 的航向 φUAP 也根据各位置的 Δx 和 Δy 分量计算得出。
𝜑𝑈𝐴𝑃 = tan⁻¹(Δ𝑦/Δ𝑥) = tan⁻¹( (−4,890−(−4,941)) / (4,251−4,510) ) = −11.14° (14)
UAP 航向沿 +x 轴向前,并略微朝负 y 方向,与 F/A-18(-9.6°)大致同向移动,但约慢9倍。需提醒,所有所示位置和方向都是相对于所定义的坐标系。若不知道 F/A-18 的位置或航向,就无法参照北、南、东、西等方向。
估算 UAP 的行进路径
前几节解释了用于计算 UAP 在时间区间两个端点 t1 和 t2 处位置的方法。所得速度和相对航向假定 UAP 在这两点之间沿大致笔直、直接的路径行进。随后将相同的数学方法应用于这13秒视频的每一帧,以估算 UAP 从第一点到最后一点的连续路径。此计算需要对所有帧的时间、传感器方位角和俯仰角、到目标距离,以及 F/A-18 位置进行估算。元数据确实提供了相对帧时间,在30赫兹的视频中,帧与帧之间间隔0.033秒。
F/A-18 的路径
F/A-18 的高度、横滚角和空速在 t1 与 t2 之间保持恒定。因此,由(6)其飞行路径的曲率半径保持恒定。每个时间点行进的距离是经过的帧时间乘以速度。位置和偏航随后使用前述方法计算。
UAP 的路径
传感器方位角、传感器俯仰角和到物体的距离在视频期间不断变化。传感器的显示以整数指示这些变化,因此许多帧过去后某个数值才递增或递减。通过记录某个量递增或递减的帧和时间,可做出更准确的估算。例如,在
— p. 14 — UNCLASSIFIED
14
UNCLASSIFIED
value changes from 50 to 51, the value in that frame must be 51.0 (or 50.56) in that frame. These
“change frames” were identified for the sensor azimuth, sensor elevation, and range to target in
the time interval from t1 to t2 and are represented by the black dots in the plots in Figures 5-8.
The values for all frames between 4239 seconds and 4252 seconds were estimated by fitting a 2nd
order polynomial curve to the datapoints. These curves are the dotted lines plotted in Figures 5-8
and are generally a very good fit through the black dots. The fit equation and R2 fit error
estimate are also provided. An R2 equal to 1 would be a perfect fit to the data.
Figure 7: The sensor azimuth “change frame” data points are plotted vs frame time. The dotted
line was fit to the points to estimate the azimuth for all frames in the time interval.
6 Whether the value is 50.5 or 51.0 does not make a difference as the times and positions are all relative and speed is found by
subtraction. An uncertainty error of 0.033 seconds remains for each frame but is negligible here.
— 第 14 页 — 某数值从50变为51的那一帧中,该帧中的数值必定为51.0(或50.56)。在 t1 至 t2 的时间区间内,为传感器方位角、传感器俯仰角和到目标距离识别出这些“变化帧”,并由图5–8 中图上的黑点表示。4239秒至4252秒之间所有帧的数值,通过对数据点拟合一条二阶多项式曲线来估算。这些曲线即图5–8 中绘制的虚线,通常与黑点非常吻合。拟合方程和 R² 拟合误差估计也一并给出。R² 等于1将是对数据的完美拟合。
图7:传感器方位角“变化帧”数据点相对帧时间作图。虚线拟合于这些点,以估算该时间区间内所有帧的方位角。
⁶ 数值是50.5还是51.0并无差别,因为时间和位置都是相对的,速度通过相减求出。每帧仍存在0.033秒的不确定误差,但在此可忽略。
— p. 15 — UNCLASSIFIED
15
UNCLASSIFIED
Figure 8: The sensor elevation “change frame” data points are plotted vs frame time. The dotted line was fit to the
points to estimate the elevation for all frames in the time interval.
Figure 9: The range to target “change frame” data points are plotted vs frame time. The dotted line was fit to the
points to estimate the range for all frames in the time interval.
With values estimated for all frames and times, the vector rotation and point translation
methodology described in the previous section were applied to find the UAP’s three-dimensional
flight path. The resulting path through the x-y plane is plotted in Figure 8. The UAP’s direction
of travel is a relatively straight path from the top left to the bottom right. The altitude profile is
provided in Figure 9 and shows the UAP rising about 10 m (30 ft) with a slow, curving descent
— 第 15 页 — 图8:传感器俯仰角“变化帧”数据点相对帧时间作图。虚线拟合于这些点,以估算该时间区间内所有帧的俯仰角。
图9:到目标距离“变化帧”数据点相对帧时间作图。虚线拟合于这些点,以估算该时间区间内所有帧的距离。
在估算出所有帧和时间的数值后,将前一节描述的向量旋转和点平移方法应用于求出 UAP 的三维飞行路径。所得通过 x-y 平面的路径绘制在图8中。UAP 的行进方向是从左上到右下相对笔直的路径。高度剖面在图9中给出,显示 UAP 上升约10米(30英尺),并在末尾附近缓慢、弯曲地下降。
— p. 16 — UNCLASSIFIED
16
UNCLASSIFIED
near the end. The bends at the end of both curves may indicate a slight change of direction but is
more likely due to residual error in the estimation of the F/A-18 flight path.
Figure 10: The position of the UAP in the x-y plane is shown over the time considered. The direction of flight is
from the upper left to the lower right.
Figure 11: The altitude of the UAP as a function of time indicates a slow rise over most of the
path with a slight descent in the last few seconds.
The beginning and end points of the path defined by Figures 8 and 9 were compared to the
results from the end-point analysis in the previous section to verify the path calculations are
consistent and that the methodology was correctly applied. The results are provided in Table II
— 第 16 页 — 两条曲线末尾的弯折可能表明方向略有变化,但更可能是由于 F/A-18 飞行路径估算中的残余误差。
图10:所考虑时间内 UAP 在 x-y 平面中的位置。飞行方向为从左上到右下。
图11:UAP 高度随时间的变化,表明在大部分路径上缓慢上升,并在最后几秒略有下降。
由图8和图9定义的路径起点和终点,与前一节端点分析的结果进行了比较,以验证路径计算一致且方法已正确应用。结果在表II 中给出
— p. 17 — UNCLASSIFIED
17
UNCLASSIFIED
and show good agreement. Because the frame-by-frame method estimates the parameters to a
better precision than just integers and more accurately assigns the time to each value, it is
presumed that this method is more accurate.7
Table II: Comparison of results from the two-point and Continuous Path analysis.
Incorporating Prevailing Winds
To this point, analysis has assumed no effect from the speed and direction of the winds aloft on
the flight path of the F/A-18. The speed on the sensor display in Mach number represents the
relative air speed of the aircraft and does not consider the ambient wind velocity. With a
methodology in place to calculate the UAP locations, the possible effects of the winds at altitude
were explored. This is done by adding the speed and direction of the wind to the speed and
direction of the F/A-18 to obtain a new flight path, then determining the UAP flight path as
described in the previous sections.
Wind Speed and Direction
No information on atmospheric conditions was provided with the UAP report or video, only a
time and general location. Therefore, the historical data for wind speed, direction, and altitude
were sourced from a historical database (ref 9]. The data for the appropriate date and location
were found and were within 15-20 minutes of the time reported with the “Go Fast” event. The
windspeed and direction are plotted in Figure 10. At 25,000 ft (7,620 m), the windspeed was
approximately 101 kts (52.0 m/s) at a heading of 255°, from primarily the West-South-West and
blowing toward the East-North-East. At 13,000 ft (3,692 m), the wind speed was 60 kts (30.9
m/s) at a heading of 265°, primarily from the west.8
7 All analytic results are relative to the accuracy of the F/A-18’s estimated flight path. It is not possible to state the accuracy for
certain without knowing the exact path of the UAP.
8 Going forward, we will use the metric system. Values here are in kts and ft to represent the data as taken from the source.Method Starting Point Ending Point Distance Speed
Continuous Path [4284, -4889, 3601] m [4500, -4953, 3592] m 226 m 17.4 m/s (38.9 mph)
First / Last Frame [4251, -4890, 3591] m [4510, -4941, 3612] m 265 m 20.4 m/s (45.6 mph)
— 第 17 页 — 并显示出良好的一致性。由于逐帧方法将参数估算到比仅整数更高的精度,并更准确地为每个数值分配时间,因此推定此方法更准确。⁷
表II:两点法与连续路径分析结果的比较。
| 方法 | 起点 | 终点 | 距离 | 速度 |
|---|---|---|---|---|
| 连续路径 | [4284, -4889, 3601] 米 | [4500, -4953, 3592] 米 | 226 米 | 17.4米/秒(38.9英里/小时) |
| 首/末帧 | [4251, -4890, 3591] 米 | [4510, -4941, 3612] 米 | 265 米 | 20.4米/秒(45.6英里/小时) |
计入盛行风
迄今为止,分析假定高空风的速度和方向对 F/A-18 的飞行路径无影响。显示器上以马赫数表示的速度代表飞机的相对空速,不考虑环境风速。在有了计算 UAP 位置的方法后,探究了高空风的可能影响。这通过将风的速度和方向加到 F/A-18 的速度和方向上以获得一条新的飞行路径,然后按前几节描述的方法确定 UAP 飞行路径来完成。
风速与风向
UAP 报告或视频未随附任何大气条件信息,只有时间和大致位置。因此,风速、风向和高度的历史数据来源于一个历史数据库[ref 9]。找到了相应日期和位置的数据,且其时间在“Go Fast”事件所报告时间的15–20分钟以内。风速和风向绘制在图10中。在25,000英尺(7,620米)处,风速约为101节(52.0米/秒),航向255°,主要来自西南偏西,吹向东北偏东。在13,000英尺(3,692米)处,风速为60节(30.9米/秒),航向265°,主要来自西方。⁸
⁷ 所有分析结果都相对于 F/A-18 估算飞行路径的准确性。在不知道 UAP 确切路径的情况下,无法确定准确性。
⁸ 后续将使用公制。此处数值以节和英尺表示,以呈现取自源数据的数据。
— p. 18 — UNCLASSIFIED
18
UNCLASSIFIED
Figure 12: Wind speed (left axis) and direction (right axis) for at the approximate location of the “Go Fast” event.
Because the exact location and heading of F/A-18 are not known, the flight path could not be
expressed in terms of compass directions. Thus, the effect of windspeed was assessed for all
possible directions; however, four cases are described first to illustrate the methodology: a
tailwind, headwind, a crosswind from the left, and a crosswind from the right relative to the F/A-
18. These directions were defined at the initial t1 location in the same coordinate system
described in Figures 3 and 4. In this coordinate system, a tailwind was defined as a heading of
0° (in the direction of the +x axis), a crosswind from the left at 90° (in the direction of the +y
axis), a headwind at 180° (in the direction of the -x axis), and a crosswind from the right at 270°
(in the direction of the -y axis).
Adjusted Flight Paths of the F/A-18
The wind velocity (speed and heading) is additive to the aircraft speed and heading at every
point. Assuming the wind is constant over the 13 second interval, the wind will essentially
“push” the F/A-18 in the direction of the wind from its calculated flight path with no wind.
Figure 11 shows adjusted flight paths accounting for wind direction with the no-wind flight path
as a black line for reference.
— 第 18 页 — 图12:“Go Fast”事件大致位置处的风速(左轴)和风向(右轴)。
由于 F/A-18 的确切位置和航向未知,飞行路径无法以罗盘方向表示。因此,针对所有可能方向评估了风速的影响;但首先描述四种情形以阐明方法:相对于 F/A-18 的顺风、顶风、来自左侧的侧风,以及来自右侧的侧风。这些方向在初始 t1 位置、按图3和图4所述的同一坐标系定义。在此坐标系中,顺风定义为0°航向(沿 +x 轴方向),来自左侧的侧风为90°(沿 +y 轴方向),顶风为180°(沿 -x 轴方向),来自右侧的侧风为270°(沿 -y 轴方向)。
F/A-18 的调整飞行路径
风速度(速度和航向)在每一点上都与飞机的速度和航向相加。假定风在13秒区间内恒定,风将基本上把 F/A-18 从其无风时计算出的飞行路径沿风向“推动”。图11显示了计入风向后的调整飞行路径,并以无风飞行路径作为黑线供参照。
— p. 19 — UNCLASSIFIED
19
UNCLASSIFIED
Figure 13: The path of the F/A-18 with no wind considered is in black. The other lines show the flight paths with a
head, tail, and two cross winds applied.
Estimated Flight Path of the UAP
With the flight path of the F/A-18 for the four wind conditions calculated, the resulting paths of
the UAP were found using the same method as in the case without wind. The four resulting
paths are plotted in Figure 12. Note than in each case, the UAP is headed in the same general
direction as the wind at the altitude of the F/A -18 (7,620 m), which is comparable to the wind
direction at the altitude of the UAP (a 10° difference as shown in Figure 10).
— 第 19 页 — 图13:不考虑风时的 F/A-18 路径为黑色。其他线显示施加了顶风、顺风和两种侧风后的飞行路径。
UAP 的估算飞行路径
在计算出四种风况下 F/A-18 的飞行路径后,使用与无风情形相同的方法求出所得 UAP 路径。四条所得路径绘制在图12中。注意,在每种情形下,UAP 都朝与 F/A-18 高度(7,620米)处风大致相同的方向行进,这与 UAP 高度处的风向相当(如图10所示,相差10°)。
— p. 20 — UNCLASSIFIED
20
UNCLASSIFIED
Figure 14: Starting and possible ending locations of the UAP given windspeed effect on the flight path of the F/A-
18. Black line represents the “no wind” case.
To expand upon this analysis and determine if there are any outlying conditions beyond the four
directions considered, the F/A-18 flight path and resulting UAP path was calculated for all wind
directions between 0° and 360° at 1° increments. Figure 13 shows the difference in the UAP
heading and the wind heading at 3,962 m as a function of the wind heading on the F/A-18. Each
of the headwind, crosswind, and tailwind cases are marked with the appropriately colored lines.
Note that there are two angles where the difference is 0° indicating the UAP is moving exactly
with the wind. Figure 14 shows the difference between the calculated UAP speed with the
contribution of the wind to the UAP speed at 3,962 m removed. This “intrinsic speed” of the
UAP represents the speed that cannot be accounted for by the wind “pushing” it and assumed to
be inherent with the UAP (e.g. a propulsion system). The minimum intrinsic speed occurs near
the case of the headwind, and maximum in the case of a tailwind. These findings indicate that
the four specific cases considered sufficiently constrain the estimated performance of the UAP in
terms of speed and heading.
— 第 20 页 — 图14:考虑风速对 F/A-18 飞行路径影响后,UAP 的起点和可能终点位置。黑线代表“无风”情形。
为扩展此分析并确定在所考虑的四个方向之外是否存在任何异常情况,以1°增量计算了0°至360°所有风向下的 F/A-18 飞行路径和所得 UAP 路径。图13显示了3,962米处 UAP 航向与风向之差作为 F/A-18 上风向的函数。顶风、侧风和顺风情形各自用相应颜色的线标示。注意有两个角度处该差值为0°,表明 UAP 正好随风移动。图14显示了在去除风对 UAP 速度的贡献后,计算出的 UAP 速度在3,962米处之差。这一 UAP 的“固有速度”代表无法由风“推动”所解释、并假定为 UAP 固有(例如推进系统)的速度。最小固有速度出现在接近顶风的情形,最大出现在顺风的情形。这些发现表明,所考虑的四种特定情形充分约束了 UAP 在速度和航向方面的估算性能。
— p. 21 — UNCLASSIFIED
21
UNCLASSIFIED
Figure 15: The y axis values are the difference between the heading of the UAP and the wind direction at the
altitude of the UAP. The x axis values are the heading of the wind with respect to the F/A-18. The tailwind,
headwind, and crosswinds are the colored lines.
Figure 16: The y axis values are the difference between the heading of the UAP and the wind direction at the
altitude of the UAP. The x axis values are the heading of the wind with respect to the F/A-18. The tailwind,
headwind, and crosswinds are the colored lines.
— 第 21 页 — 图15:y 轴数值是 UAP 航向与 UAP 高度处风向之差。x 轴数值是风相对于 F/A-18 的航向。顺风、顶风和侧风为彩色线。
图16:y 轴数值是 UAP 航向与 UAP 高度处风向之差。x 轴数值是风相对于 F/A-18 的航向。顺风、顶风和侧风为彩色线。
— p. 22 — UNCLASSIFIED
22
UNCLASSIFIED
Results
A summary of the results for the distance traveled, intrinsic speed, and relative heading with
respect to wind direction are provided in Table III for the four directional cases considered. The
wind direction at 3,692 m, the altitude of the UAP, was calculated by adding 10° to the direction
at 7,620 m, the altitude of the F/A-18 (see Figure 10). The wind directions in the Table III are
again with respect to the position of the F/A-18 at t1.
Table III: UAP speed and heading with windspeed considered.
Visualizations
To visualize the F/A-18 flight paths shown in Figure 11 and the directions with respect to the
winds at altitude, they were placed on a map. Instead of relative to the F/A-18, the wind
directions will now be defined assuming the wind was blowing from 255° as reported. Figure 15
displays the four flight directions on a map with the F/A-18 placed in an arbitrary location off the
east coast of Florida. While the directions and relative lengths of the paths are accurate, the
exact locations and path lengths are for visualization purposes only.
Figure 17: The possible directions of flight of the F/A-18 based on the assumed wind at 7,620 m from a direction of
255°. The relative lengths of the paths are representative of the distance flown.
To visualize the UAP speed and heading they were also placed on the map off the coast of
Florida. Figures 16-19 display the UAP position relative to the F/A-18 with two arrows: theWind Heading @ 7,620 m UAP Distance
Travelled (m)
Wind Speed @
3,962 m (m/s)
Wind Heading @
3,962 m UAP Heading
Heading
Difference from
Wind
UAP Intrinsic
Speed (m/s)
0° (Tailwind) 928.8 30.9 10° -2.3° -12.3° 41.25
90° (from Left) 687 30.9 100° 68.4° -31.6° 26.50
180° (Headwind) 425.7 30.9 190° 185° -5.0° 2.00
270° (from Right) 756.3 30.9 280° 289.5° +9.5° 27.70
Wind: 52 m/s (101 kts) @ 7,620 m (25,000 ft)
— 第 22 页 — 结果
针对所考虑的四种方向情形,关于行进距离、固有速度和相对于风向的相对航向的结果汇总在表III 中。UAP 高度3,692米处的风向,通过在 F/A-18 高度7,620米处的风向上加10°计算得出(见图10)。表III 中的风向同样是相对于 F/A-18 在 t1 的位置。
表III:计入风速后的 UAP 速度和航向。
| 7,620米处风向 | UAP 行进距离(米) | 3,962米处风速(米/秒) | 3,962米处风向 | UAP 航向 | 与风的航向差 | UAP 固有速度(米/秒) |
|---|---|---|---|---|---|---|
| 0°(顺风) | 928.8 | 30.9 | 10° | -2.3° | -12.3° | 41.25 |
| 90°(来自左侧) | 687 | 30.9 | 100° | 68.4° | -31.6° | 26.50 |
| 180°(顶风) | 425.7 | 30.9 | 190° | 185° | -5.0° | 2.00 |
| 270°(来自右侧) | 756.3 | 30.9 | 280° | 289.5° | +9.5° | 27.70 |
风:52米/秒(101节)@ 7,620米(25,000英尺)
可视化
为可视化图11所示的 F/A-18 飞行路径及其相对于高空风的方向,将它们置于一张地图上。风向现在不再相对于 F/A-18,而是假定风如所报告的从255°吹来。图15在地图上显示四个飞行方向,F/A-18 被置于佛罗里达州东海岸外的一个任意位置。虽然路径的方向和相对长度是准确的,但确切位置和路径长度仅用于可视化目的。
图17:基于7,620米处假定来自255°方向的风,F/A-18 的可能飞行方向。路径的相对长度代表所飞行的距离。
为可视化 UAP 的速度和航向,也将它们置于佛罗里达州海岸外的地图上。图16–19 用两个箭头显示 UAP 相对于 F/A-18 的位置:
— p. 23 — UNCLASSIFIED
23
UNCLASSIFIED
black arrow is the direction of the wind at 3,692 m (the altitude of the UAP), and the colored
arrow is the direction of travel of the UAP (not the path or distance traveled of the UAP). The
lengths of the arrows correspond to the true (not intrinsic) speed of the UAP (again, not the path
of the UAP) and the windspeed. Arrows of the same length would mean the total UAP speed is
the same as that of the wind. Arrows in the same direction mean that the UAP is going in the
same direction as the wind. The more different the lengths or directions of the arrows, the less
effect the wind has on the speed of the UAP.
Figure 18: The direction of flight and speed of the UAP in the case of the F/A-18 flying into a headwind. The UAP
is going in nearly the same direction and at the same speed as the wind.
Figure 19: The direction of flight and speed of the UAP in the case of a crosswind from the left side of the F/A-18.
The UAP is going faster than the wind and in a more northerly direction.
— 第 23 页 — 黑色箭头是3,692米处(UAP 高度)的风向,彩色箭头是 UAP 的行进方向(而非 UAP 的路径或行进距离)。箭头的长度对应 UAP 的真实(而非固有)速度以及风速(同样,而非 UAP 的路径)。等长的箭头意味着 UAP 总速度与风速相同。同向的箭头意味着 UAP 与风同向。箭头的长度或方向差异越大,风对 UAP 速度的影响越小。
图18:F/A-18 迎顶风飞行情形下 UAP 的飞行方向和速度。UAP 与风几乎同向、同速行进。
图19:F/A-18 左侧侧风情形下 UAP 的飞行方向和速度。UAP 比风更快,并朝更偏北的方向行进。
— p. 24 — UNCLASSIFIED
24
UNCLASSIFIED
Figure 20: The direction of flight and speed of the UAP in the case of the F/A-18 flying with a tailwind. The UAP
is going over twice as fast as the wind in somewhat the same direction.
Figure 21: The direction of flight and speed of the UAP in the case of a crosswind from the right of the F/A-18.
The UAP is going much faster than the wind but in nearly the same direction.
Conclusions
The methodology used to analyze the “Go Fast” event was derived from standard FMV analysis
and successfully applied to data manually extracted from a publicly available .wmv video of the
FLIR sensor display of an F/A-18. Accuracy of the results were limited by the precision and
accuracy of the data and assumptions made regarding the flight parameters of the F/A-18 (e.g.,
the curved flight path). Calculations of the UAP’s exact position and heading were not possible
given that the true track data in latitude and longitude of the F/A-18 were not provided nor were
the atmospheric conditions. Thus, the estimations of the speed and relative direction of travel are
used to bound results under a range of conditions to constrain the possible characteristics and
performance of the UAP.
— 第 24 页 — 图20:F/A-18 顺风飞行情形下 UAP 的飞行方向和速度。UAP 以风速两倍多的速度、大致同向行进。
图21:F/A-18 右侧侧风情形下 UAP 的飞行方向和速度。UAP 比风快得多,但方向几乎相同。
结论
用于分析“Go Fast”事件的方法源自标准 FMV 分析,并成功应用于从公开可得的 FLIR 传感器显示的 F/A-18 .wmv 视频中手动提取的数据。结果的准确性受限于数据的精度和准确性,以及就 F/A-18 飞行参数所作的假设(例如弯曲的飞行路径)。鉴于未提供 F/A-18 真实的经纬度航迹数据,也未提供大气条件,无法计算 UAP 的确切位置和航向。因此,速度和相对行进方向的估算用于在一系列条件下界定结果,以约束 UAP 的可能特征和性能。
— p. 25 — UNCLASSIFIED
25
UNCLASSIFIED
The UAP altitude was found to be ≈3,962 m (13,000 ft) above sea level. There is high
confidence in this result as it required only the sensor pointing angles and range to target. This
calculation does not depend on the absolute position of the F/A-18 or wind speed.
The speed and heading of the UAP varied based upon assumptions of the path of the F/A-18
relative to the winds at its operating altitude. In the case of the aircraft flying into a nominal
headwind, the UAP was determined to be heading within 5° of the wind direction at its altitude
and <2 m/s (4.5 mph, 3.9 kts) faster than the wind. At other angles of wind impacting flight of
the F/A-18, the UAP was as far as 27.0° from the wind direction and as much as 40 m/s (89 mph,
78 kts) faster (see Table III). With the uncertainty in the wind directions and speed and those
mentioned above, these quantitative results should not be used literally, but only to qualitatively
evaluate the UAP properties.
Considerations of Parallax Effect
When the F/A-18 is flying into a headwind as shown in Figure 16, it and the UAP would be
moving in opposite directions. In the case with no wind, the UAP is moving in the same
direction as the F/A-18 albeit much slower. This situation is illustrated in Figure 20. On the left
of Figure 20 shows a side view of the event with no wind and on the right the event considering a
headwind. For each, the dashed arrows show the UAP starting and stopping points projected to
the surface. The distance between these two points (red arrows) is the perceived distance the
UAP traveled due to parallax. The longer the projected distance (red arrow) compared to the
actual distance traveled (black arrow) at 3,962 m causes the perceived high speed of the UAP in
the video. With a headwind and the UAP going in the opposite direction of the F/A-18, this
affect is amplified and the UAP speed appears much faster leading to higher likelihood of
misinterpretation.
— 第 25 页 — UAP 高度被求出约为海平面以上3,962米(13,000英尺)。这一结果具有高置信度,因为它仅需要传感器指向角和到目标距离。该计算不依赖于 F/A-18 的绝对位置或风速。
UAP 的速度和航向基于对 F/A-18 相对于其作业高度风的路径所作的假设而变化。在飞机迎标称顶风飞行的情形下,UAP 被确定为航向在其高度处风向的5°以内,并比风快<2米/秒(4.5英里/小时,3.9节)。在影响 F/A-18 飞行的其他风角下,UAP 偏离风向最远达27.0°,并最多快40米/秒(89英里/小时,78节)(见表III)。鉴于风向和风速的不确定性以及上述各点,这些定量结果不应按字面使用,而仅用于定性评估 UAP 的特性。
视差效应的考量
当 F/A-18 如图16所示迎顶风飞行时,它和 UAP 会朝相反方向移动。在无风的情形下,UAP 与 F/A-18 同向移动,尽管慢得多。这种情况如图20所示。图20左侧显示无风时事件的侧视图,右侧显示考虑顶风时的事件。对于每种情况,虚线箭头显示 UAP 投影到地面的起点和终点。这两点之间的距离(红色箭头)是由于视差而被感知到的 UAP 行进距离。投影距离(红色箭头)相比3,962米处实际行进距离(黑色箭头)越长,造成视频中 UAP 被感知到的高速越快。当顶风且 UAP 朝 F/A-18 相反方向行进时,此效应被放大,UAP 速度显得快得多,导致误判的可能性更高。
— p. 26 — UNCLASSIFIED
26
UNCLASSIFIED
Figure 22: With the F/A-18 flying into the wind, the UAP apparent high speed due to parallax (right) is amplified
compared to the results with no wind at all (left).
Summary
Although a complete set of data to fully solve for the location, speed, and heading of the “Go
Fast” UAP was not available at the time of this writing, AARO has high confidence that the
UAP did not exhibit anomalous or even exceptional behavior. This conclusion is based on the
results of our analysis of the range of possible scenarios. AARO notes that there is a range of
winds where the object is moving generally at windspeed and in the direction of the wind.
These foundational GEOINT techniques can be applied to a range of UAP case studies and will
be incorporated into AARO tradecraft. AARO did analyze the short section of the video from
approximately 4233 to approximately 4236 seconds where the target was acquired and the F/
A-18 flying mostly level. Results were similar to those presented here and do not change the
assessment, though the shorter section of video may result in higher uncertainty.
References
1. https://www.aaro.mil/UAP-Cases/UAP-Case-Resolution-Reports/
2. https://www.geospatialexploitationproducts.com/content/socet-gxp/
3. https://nsgreg.nga.mil/doc/view?i=5471
4. https://www.navair.navy.mil/foia/sites/g/files/jejdrs566/files/2020-04/3%20-%20GOFAST.wmv
5. NASA Mach number calculator
6. Refer to Section 4.9.1, p. 357 in the CRC Standard Mathematical Tables and Formulae (1983) for more details
on matrix multiplication and angle rotations about the cartesian axes.
7. Refer to Section 4.8.4, p. 356 in the CRC Standard Mathematical Tables and Formulae (1983) for more details
on relations between Cartesian and cylindrical coordinates.
8. https://earth.nullschool.net
— 第 26 页 — 图22:当 F/A-18 迎风飞行时,UAP 因视差而产生的表观高速(右)相比完全无风时的结果(左)被放大。
摘要
尽管在撰写本文时,无法获得完整求解“Go Fast”UAP 的位置、速度和航向所需的全套数据,AARO 仍以高置信度认为该 UAP 未表现出异常甚至特殊的行为。此结论基于我们对一系列可能情形的分析结果。AARO 指出,存在一段风况范围,在其中物体大致以风速、沿风向移动。
这些基础 GEOINT 技术可应用于一系列 UAP 案例研究,并将被纳入 AARO 的技术方法。AARO 确实分析了视频中约4233至约4236秒、目标被获取且 F/A-18 大致平飞的短片段。结果与此处呈现的相似,不改变评估结论,尽管较短的视频片段可能导致更高的不确定性。
参考文献
1. https://www.aaro.mil/UAP-Cases/UAP-Case-Resolution-Reports/
2. https://www.geospatialexploitationproducts.com/content/socet-gxp/
3. https://nsgreg.nga.mil/doc/view?i=5471
4. https://www.navair.navy.mil/foia/sites/g/files/jejdrs566/files/2020-04/3%20-%20GOFAST.wmv
5. NASA 马赫数计算器
6. 关于矩阵相乘和绕笛卡尔轴的角度旋转的更多细节,参见《CRC 标准数学表与公式》(1983)第4.9.1节,第357页。
7. 关于笛卡尔坐标与柱坐标之间关系的更多细节,参见《CRC 标准数学表与公式》(1983)第4.8.4节,第356页。
8. https://earth.nullschool.net